
How to Find the Mean, Median, Mode, and Range
- Math Lessons >
- Mean, Median, Mode, and Range
Overview of Mean, Median, Mode, and Range:
- Mean, Median, and Mode - Video Lesson
- What Is a Data Set?
- How to Construct a Data Set
- How to Find the Mean of a Data Set
- How to Find the Median of a Data Set
- Determine the Mean of Data Values Right Away Using Mean Calculator
- How to Find the Mode of a Data Set
- How to Find the Range of a Data Set
- Missing Data Values
- Key Takeaways
- Mean, Median, Mode, and Range - Quiz
In this lesson, we’ll dive deep into the three important measures of central tendency: the mean, the median, and the mode. In addition, we’ll learn to calculate the range of a data set. But before we get started, let’s figure out what a data set is.
What Is a Data Set?
A data set is a collection of numbers or values that relate to a particular subject. The elements of a data set are also referred to as data points or observations.
Examples
Changes in the weather at a place over a period of time

Heights of students in your class
Growth in the population of a state
To make sense of all the data that is collected and turned into information, we need a single value that will give us an overview of the entire data set. Average is that single measure used to indicate where most of the data points are concentrated. The three measures of central tendency – mean, median, and mode – are nothing but different types of averages. Now, coming to range, it says how varied a data set is.
To find the 3 Ms - the mean, median, and mode, and the range, we first need a data set to work on. Let’s then get busy collecting data.
How to Construct a Data Set
Gathering data is the basic step in preparing a data set. Let’s take this scenario for instance and make a data set:
Greg, Hannah, Amanda, Jake, and Sandra are tasked with building a cookie tower each with the highest number of cookies they can use in a minute. Here are the towers they build:
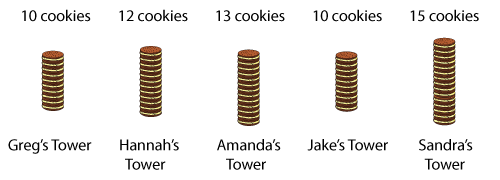
Now, this is our data set.
10, 12, 13, 10, 15
Let’s get started with finding the mean now!
How to Find the Mean of a Data Set
The arithmetic mean, or the typical average, is a measure that denotes the central location of a data distribution.
Now to find the average number of cookies that can be stacked in a minute, we need to rearrange the cookie towers and distribute the cookies in such a way that all towers are equally tall.
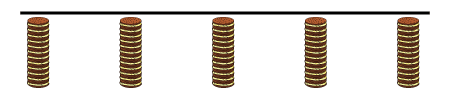
As you can see, each tower has 12 cookies. This is the mean of the data set.
But what if the entire class of 15 participated? We would need to process huge amounts of data, and it would be difficult to rearrange it.
Thankfully, math formulas are a lifesaver! Here’s the formula to calculate mean:
Mean = Sum of the Data ValuesNumber of Data Values
So, all we need to do is add the cookies in all towers to build a super-tall cookie tower and divide the total by the number of participants.
Mean = 10 + 12 + 13 + 10 +155.
= 605.
= 12.
So to make cookie towers of equal heights, there must be 12 cookies in each.

Determine the Mean of Data Values Right Away Using Mean Calculator
Type any number of data values separated by commas, and calculate the mean in no time!
Let’s get busy finding the median now!
How to Find the Median of a Data Set
The median is the middle value of a data set. The median splits a data distribution into two such that there are an equal number of values below as well as above it.
Let’s work out the median of the data set:
10, 12, 13, 10, 15
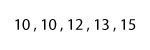
To find the median, we need to rearrange the list of numbers from the least to the greatest. We now have:
10, 10, 12, 13, 15
Our data set has five values. It’s easy to look for the middle number in a data set with an odd number of elements.
Get to the middle value with a click on the numbers!
We are left with 12, which is our median. The data point 12 divides the data set into two equal halves.
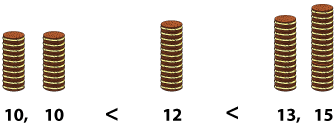
As you can see, the cookie towers to the left have fewer than 12 cookies, and those toward the right have more than 12 cookies.
But, what if we had an even number of values in the data set? Let’s imagine there was another participant, Susan, who had 8 cookies in her tower.

Now, our sorted data set is 8, 10, 10, 12, 13, 15. Let’s find the median of the data set with an even number of values.
After eliminating the numbers from both the left and right one by one, we’ll arrive at two numbers in the middle.
8, 10, 10, 12, 13, 15
This means that our median is somewhere between 10 and 12. To figure it out, simply find the mean of these two numbers.
Mean of 10 and 12 = 10 + 122
Median = 222
= 11
11 is our median.
Again for huge data sets where eliminating numbers one by one would be a dreary process, we can find the median by following these simple steps:
Step 1: Sort the data points in ascending order.
Step 2: Count the number of data points.
Step 3:
Case 1: If there are an odd number of values, add 1 to the count and divide by 2. The answer obtained denotes the position of the median.
Suppose there are 51 entries in a data set. The position of the median is:
= 51 + 12
= 522.
which means the median is the 26th data point in the sorted data set.
Case 2: If there are an even number of values, divide the count by 2. The answer denotes the position of a data point that when added to the next data point gives the median.
For a data set with 100 elements, we must arrange the values from the least to greatest. Then,
Median = 50th data point + 51st data point2(∵1002 = 50)
Let’s learn and explore finding the mode now!
How to Find the Mode of a Data Set
Mode is nothing but the most often repeated number in the data set. Remember this with the first letters.
Mode – Most Often
Let’s check our data set.
10, 10, 12, 13, 15
We have 2 tens, 1 twelve, 1 thirteen, and 1 fifteen. The only number that is repeated here is 10.
So, 10 is our mode.
There may be data sets that have no modes, as the one below:
8, 10, 12, 13, 15 (None of the numbers is repeated).
Or two modes, as in this one:
10, 10, 12, 13, 15, 12 (10 and 12 appear twice).
A data set can have any number of modes. A set with two modes is called a bimodal distribution, and a set that has three modes is called a trimodal distribution. If there are many modes in a set, it’s called a multimodal distribution.
How to Find the Range of a Data Set
The range is the easiest and an effective measure of spread. It’s nothing but the difference between the maximum and minimum value of a data set. The formula for the range is:
Range = Maximum Value – Minimum Value
Now, in our data set: 10, 10, 12, 13, 15, the tallest cookie tower has 15 cookies and the shortest has 10 cookies.
Range = 15 - 10
= 5
The range is 5.
Example 1
Find the mean, median, mode, and range of Allan’s test scores.
Mean:
We know that mean = Sum of the scoresNumber of tests.
Sum of the scores = 89 + 95 + 90 + 90 + 96 + 98
= 558
Number of tests = 6
Mean = 5586
= 93
Thus, 93 is the mean score.
Median:
Ordering the scores from the least to the greatest, we have:
89, 90, 90, 95, 96, 98
We have an even number of test scores. So, we have two middle numbers – 90 and 95.
Median = 90 + 952
= 1852
= 92.5
Therefore, 92.5 is the median score.
Mode:
89, 90, 90, 95, 96, 98
The most frequently occurring score is 90. So, the mode of Allan’s scores is 90.
Range:
Minimum score: 98
Maximum score: 89
Range = 98 – 89
= 9
The range of Allan’s scores is 9.
Example 2
Calculate the mean, median, mode, and range of the time (in minutes) Anna spends jogging every day.
Mean:
Anna’s mean jogging time = 45 + 15 + 20 + 18 + 20 + 25 + 327
= 1757
Mean = 25 minutes.
Median:
Arranging the data set in increasing order, we get:
15, 18, 20, 20, 25, 32, 45
The number of days is odd. So, the middle value: 20 minutes is Anna’s median jogging time.
Mode:
15, 18, 20, 20, 25, 32, 45
The most frequent value in the data set is 20. So, the mode of Anna’s jogging time is 20 minutes.
Range:
Maximum Time: 45 minutes
Minimum Time: 15 minutes
Range = 45 - 15
=30
The range of the jogging time is 30 minutes.
Missing Data Values
When we observe the calculations of the mean, median, and mode closely, we can conclude that mean is the only measure that takes each data value into account. In other words, we can find any missing data value if we know the mean of the data set. Interesting, isn’t it? Look at this scenario:
Elsa registers for a course in typing. Her tutor keeps track of her typing speed but misses to record the value of the 6th day. She has it recorded that Elsa’s mean typing speed is 55 words per minute, though.
Let’s find the missing entry now.
We know that mean = sum of observationsnumber of observations.
⇨ 55 = 36 + 45 + 46 + 58 + 66 + x + 677
55 = 318 + x7
55 x 7 = (318 + x) 77 [multiplying by 7 on both sides]
385 – 318 = 318 + x – 318 [subtracting 318 from both sides]
x = 67.
So, Elsa’s typing speed on day 6 was 67 words per minute.
Key Takeaways
A data set is a collection of data values or data points relating to a subject. The single value that can summarize a data set is the average.
There are three types of average – the three major measures of central tendency. They are the mean, median, and mode.
The mean is the common average. It is the sum of all data values divided by the number of data values.
The median is the middle value of the data set. It splits the data distribution into two equal halves.
The mode is the data value that occurs or repeats the most in a set. A data set can have a single mode, two or more modes, or no modes at all.
The range measures how varied a data set is. It is the difference between the maximum value and the minimum value.

Beef up your skills with our free printable Mean, Median, Mode and Range worksheets!