
How to Solve Systems of Equations by Graphing
- Math Lessons >
- Solve Systems of Equations by Graphing
Overview of Solve Systems of Equations by Graphing:
- How Does Graphing Help Solve a System of Equations?
- Solving a System of Equations by Graphing
- Graphing Equations Using Slope and Y-Intercept and Solving: Case 1
- Graphing Equations Using Slope and Y-Intercept and Solving: Case 2
- Graphing Equations Using X- and Y-Intercepts and Solving
- It’s Your Turn Now!
- The Gist of What We Learned So Far!
- Graphing Tool
- Solving Systems of Equations by Graphing - Quiz
How Does Graphing Help Solve a System of Equations?
When we graph a linear equation on a coordinate plane, we get a straight line. You might wonder how this would help solve a system of linear equations. Now, look at this system.
y = −x − 2
y = 4x + 3
When the equations are graphed on a grid, we’ll have:
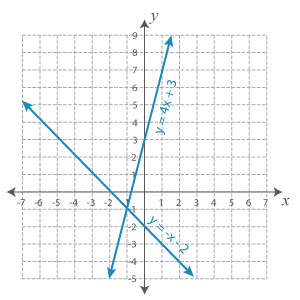
When we consider each line individually, every point on it is the solution of respective equation. But, we need to look for a solution that satisfies both equations simultaneously.
What do you think would be the solution of the system?
You’re right! The point of intersection of the two lines is the solution of the system. Here, the system has a unique solution and that would be (−1, −1).
What if the lines don’t intersect?
There are two situations, we must consider.
✯ When the lines are parallel, the system has no solution.
✯ When both equations represent the same line, the system has infinitely many solutions.
In this lesson, we’ll deal with graphing and solving systems of equations that have a unique solution.
Solving a System of Equations by Graphing
Let’s look at the step-by-step process of solving a linear system by graphing.
Step 1: Analyze what form each equation of the system is in.
Step 2: Graph the equations using the slope and y-intercept or using the x- and y-intercepts.
Case 1: If the equations are in the slope-intercept form, identify the slope and y-intercept and graph them.
Case 2: If one of the equations is in slope-intercept form, rewrite the other one too in that form and graph them.
Case 3: If both the equations are in other forms, find the x- and y-intercepts and graph them.
Step 3: The ordered pair of the point where the two lines intersect is the required solution.
Let’s explore solving systems of equations in each of the cases.
Graphing Equations Using Slope and Y-Intercept and Solving: Case 1
Here’s a linear system:
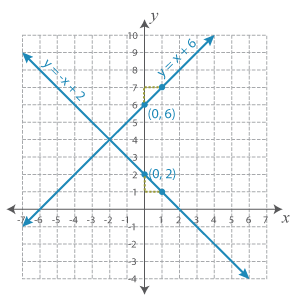
y = −x + 2
y = x + 6
The given equations are already in the form y = mx + b, where m is the slope and b is the y-intercept. So, let’s move on to graphing them.
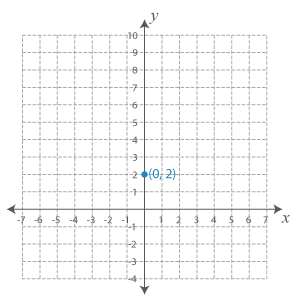
To graph the first equation, we need to use the slope and y-intercept.
The y-intercept in this case is 2. So, let’s plot the point (0, 2) on the coordinate plane.
Now, the slope is −1. So, let’s move down 1 unit and right 1 unit and plot another point.
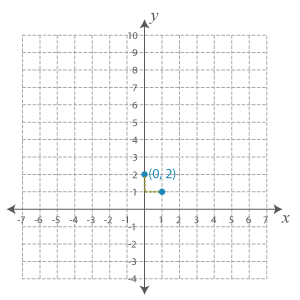
When we connect these two points drawing a line, we get the graph of the first equation.
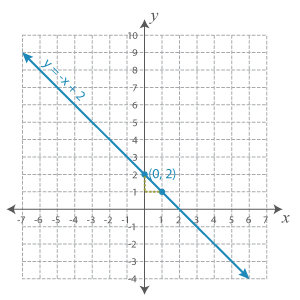
Let’s graph the second equation in the similar manner, too.
The y-intercept is 6. So, we need to plot (0, 6) on the grid.
The slope is 1. So, we must move up 1 unit and right 1 unit and plot the other point.
Drawing a line connecting the points, we have:
As you can see, both the lines intersect at a point. Let's label it on our graph.
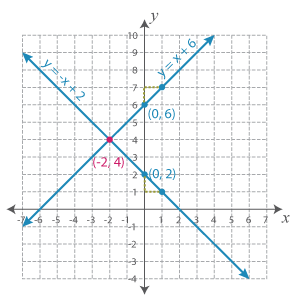
Now, the ordered pair that corresponds to the point of intersection of the equations is the required solution.
Thus, the solution of the system of equations is (−2, 4).
Example
Solve y = −x + 7 and y = 2x3 − 3 graphically.
Both equations are in the slope-intercept form.
Equation 1: m = −1; b = 7
Equation 2: m = 23; b = −3
Representing the equations graphically we have:
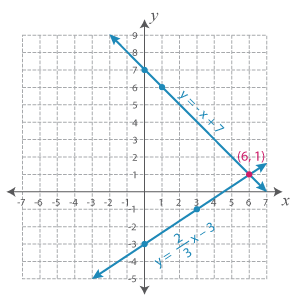
The point of intersection of the two lines is (6, 1).
The solution is (x, y) = (6, 1).
Check Your Solution!
You can cross-check if your solution is right by substituting the x and y values in the equations.
Plugging (6, 1) in equation 1, you get:
1 = −6 + 7
1 = 1 ✔
Plugging (6, 1) in equation 2, you get:
1 = 2 (6)3 − 3
1 = 123 − 3
1 = 4 − 3
1 = 1 ✔
Graphing Equations Using Slope and Y-Intercept and Solving: Case 2
Look at this system:
x + 3y = 0
y = −x2 + 52
The former is in the standard form and the latter is in the slope-intercept form. Let’s rearrange and rewrite equation 1 in the form y = mx + c.
Subtracting x from both sides:
3y = −x
Dividing both sides by 3:
y = −x3
So, equation 1 has a slope of −13 and y-intercept 0.
Equation 2 has a slope of −12 and y-intercept of 52.
Representing the system graphically, we have:
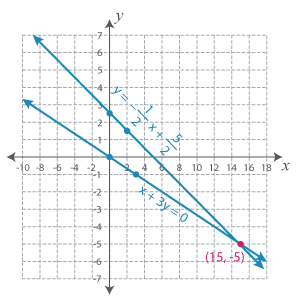
As you can see, the lines cut each other at (15, −5).
Thus, the solution of this system is (x, y) = (15, −5).
Note: You can also graph the second equation using the x- and y-intercepts rather than rewriting them in slope-intercept form.
Graphing Equations Using X- and Y-Intercepts and Solving
If both the equations are rendered in standard form as this system:
−8x + y = −4
x − y = −3
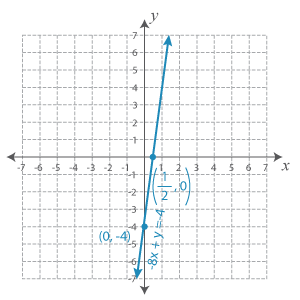
We’ll find the x and y-intercepts and solve this system. When we plug y = 0 in the equations, we’ll get the x-intercepts; similarly, when we set x =0, we’ll get the y-intercepts.
Plugging y = 0 in equation 1, we get:
−8x + 0 = −4
−8x−8 = −4−8 [Dividing both sides by −8]
⇨ x = 12
The x-intercept is (12, 0).
Plugging x = 0 in equation 1, we get:
−8(0) + y = −4
⇨ y = −4
The y-intercept is (0, −4).
Plugging y = 0 in equation 2, we get:
x – 0 = −3
⇨ x = −3
The x-intercept is (−3, 0).
Plugging x = 0 in equation 2, we get:
0 – y = −3
−y−1 = −3−1 [Dividing both sides by −1]
⇨ y = 3
The y-intercept is (0, 3).
Let’s plot the x- and y-intercepts and graph both the equations.
Graphing equation 1, we get:
Graphing equation 2, we get:
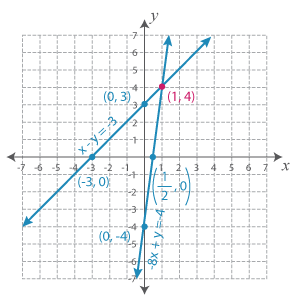
As you can see, both the lines intersect at (1, 4).
Therefore, the solution is (x, y) = (1, 4).
Note: You can also graph the system by rewriting the equations in slope-intercept form.
Thus, no matter what form the equations are in, all you need to do is graph them and identify the point of intersection.
It’s Your Turn Now!
Question 1
Question 2
Use the interactive graph below to find the solution of this system.
y = 2x – 3
y = 3x – 2
Drag the point on the line and drop it on the spot you want to plot it.
(x, y) =
The Gist of What We Learned So Far!
The solution of a system of equations is the point of intersection of the lines obtained when the equations are graphed.
When the lines don’t intersect and are parallel, the system has no solution.
When both the equations give the same line, the system has infinitely many solutions.
No matter which method you use to graph, the solution of a system is unique.

Scale up your skills with our free printable Solving Systems of Linear Equations worksheets!
Graphing Tool
Use this graphing tool to solve the linear systems in the quiz section. This comes with a provision to alter the scale. Move the points and lines, graph the equations, and solve the system.