Interactive Worksheets
 Worksheets by Grade
 Number Sense and Operations
 Measurement
 Statistics and Data
 Geometry
 Pre-Algebra
 Algebra
Box-and-Whisker Plot Worksheets
- Math >
- Statistics >
- Box and Whisker Plot
Work through our box-and-whisker plot worksheets, progressing from five-number summaries and interpreting box plots to identifying quartiles, interquartile ranges, and outliers, and more. Answer keys are provided for easy evaluation. Access these free worksheets to boost your analytical skills!
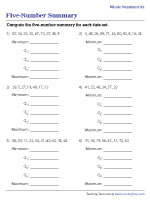
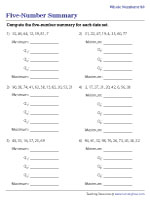
Identifying the Five-Number Summary
- Whole Numbers
- Decimals


Exclusive Box-and-Whisker Plot Worksheets for Premium Members
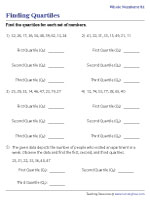
Arrange the given data in ascending order and determine the first quartile, the second quartile, and the third quartile for both whole number and decimal data sets to complete this challenge.
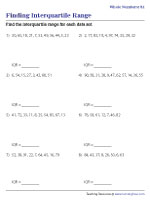
Finding the Interquartile Range
Calculate the difference between the third quartile (Q3) and the first quartile (Q1) of the given datasets to find the interquartile range in these box-and-whisker plots worksheets.
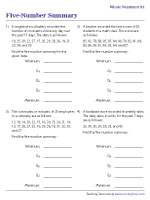
Finding the Five-Number Summary in Word Problems
Apply your knowledge to real-life scenarios! Tackle these word problems in the five-number summary worksheets and analyze each data set to derive the five-number summary.
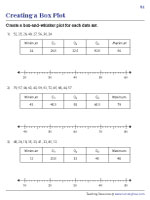
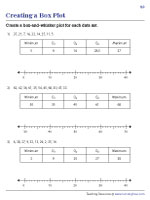
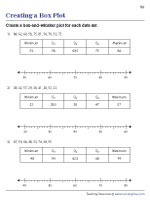
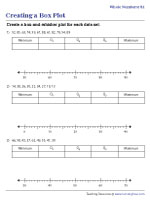
Task young learners with creating box plots using the given data sets. Instruct them to examine the data, identify Q1, Q2, Q3, maximum, and minimum values, and then create the box plot.
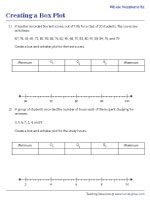
Creating Box Plots | Word Problems
Read each word problem, complete the five-number summary table, and draw the box-and-whisker plot in this collection of printables curated for 8th grade and high school students.
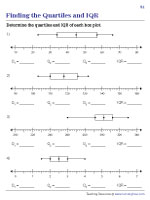
Finding Quartiles and the Interquartile Range | Box Plots
The IQR is the difference between Q3 and Q1. Practice finding the quartiles and IQR for box plots using various datasets featured in these quartiles and interquartile range worksheets.

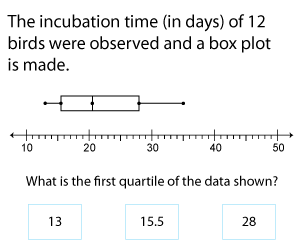
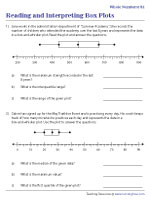
Reading and Interpreting Box Plots
Practice data analysis skills by understanding and interpreting box-and-whisker plots illustrated in this set of printables, featuring data values in whole numbers and decimals.
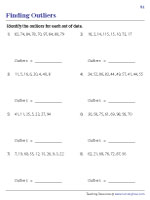
Observe the spread and distribution of data in these outliers worksheets, and find the outlier in a data set by sorting the given data in order and identifying the unusually high or low value.