Interactive Worksheets
 Worksheets by Grade
 Number Sense and Operations
 Measurement
 Statistics and Data
 Geometry
 Pre-Algebra
 Algebra
Line Plot Worksheets
- Math >
- Statistics >
- Line Plot
Mixing expert instruction with guided practice, our printable line plot worksheets help students ease into the concept. A super quick and most effective way to compare data, line plots show the distribution and frequency of data on a number line. Teach students how to organize data and display it on a number line. Aiming to foster student's skills in this unique arena, our line plot worksheets prepare them to not only distinctly identify a line plot but also to construct one from a given set of data. Start your practice with our free worksheets!


Exclusive Line Plot Worksheets for Premium Members
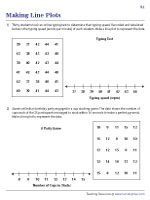
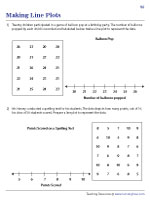
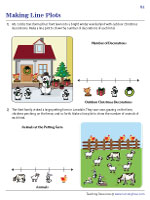
What better way to practice a line plot than through engaging themed scenarios! Employ this pdf set designed for 2nd grade and 3rd grade, and task kids with making a line plot by displaying the data as cross marks.

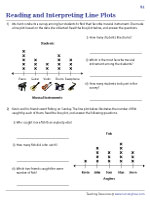
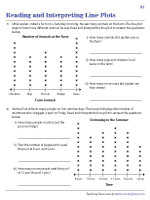
Reading and Interpreting a Line Plot | Whole Numbers
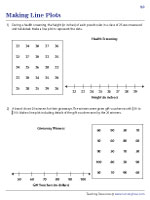
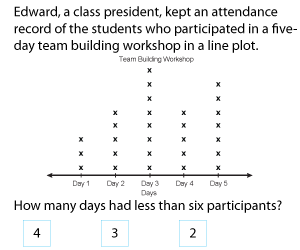
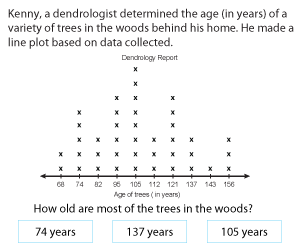
Introduce grade 5 children to this pdf exercise, and watch their ability to make sense of numerical information surge. Where each mark holds a key data point, keenly observe each graph and interpret.
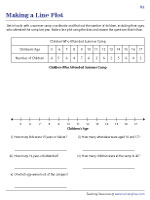
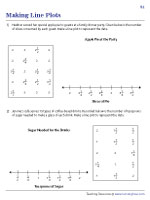
Making a Line Plot | Whole Number, Halves, and Quarters
Instruct 4th grade math enthusiasts to present the data by making a line plot, where the horizontal scale is marked off in appropriate units including whole numbers, halves, or quarters.
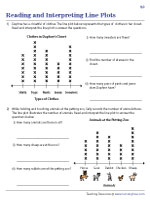
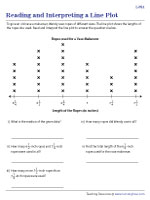
Reading and Interpreting a Line Plot | Whole Number, Halves, and Quarters
Challenge 5th grade kids to read and interpret these line plots involving fractional units and test their data interpretation skills. Explain each scenario in these pdfs and assist them to interpret the plots.
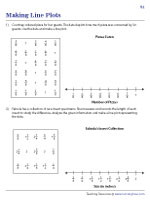
Making a Line Plot | Fraction 1/2, 1/4, 1/8
Polish your graphing skills with these line plot exercise sheets designed for grade 4! Make a line plot to display a data set of measurements in fractions of a unit (1/2, 1/4, 1/8) and solve problems involving addition and subtraction.
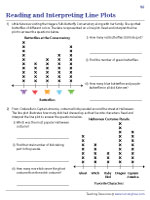
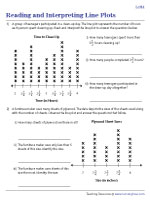
Reading and Interpreting a Line Plot | Fractions 1/2, 1/4, 1/8
Up your game with this exclusive level, where kids get to analyze an array of data. Task grade 6 learners with calculating the median, mode, and range of the data represented on the line plot.
Making a Line Plot - Activity and Interpret
Prepare to chart your course through numerical narratives in this engaging graphing journey. Take the field and gather information as instructed to sharpen your analytical skills and reveal the story told by the data.