Interactive Worksheets
 Worksheets by Grade
 Number Sense and Operations
 Measurement
 Statistics and Data
 Geometry
 Pre-Algebra
 Algebra
Bar Graph Worksheets
- Math >
- Statistics >
- Bar Graph
Our bar graph worksheets contain graphs presenting categorical data in horizontal and vertical formats. Highly structured, these exercises equipped with answer keys, help kids graduate from representing data as bar graphs to reading and interpreting bar graphs, advance from reading scaled bar graphs to figuring out double bar graphs, and up the game by constructing bar graphs. Start your practice with our free worksheets!


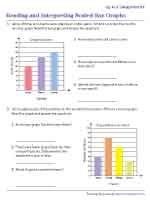
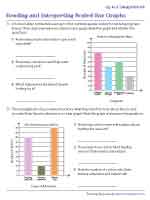
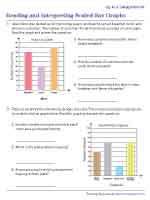
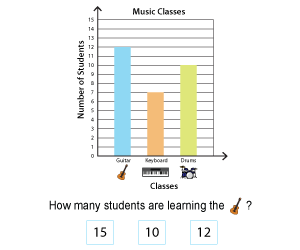
Reading and Interpreting Scaled Bar Graphs - Up to 4 Categories
- Column
- Horizontal
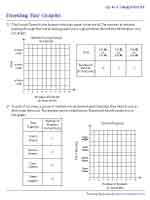
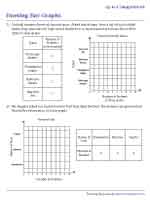
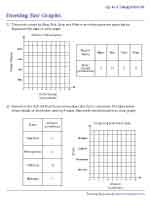
Drawing Bar Graphs | Up to 4 Categories
- Horizontal
- Column

Exclusive Bar Graph Worksheets for Premium Members
Reading and Interpreting Bar Graphs | Up to 4 Categories
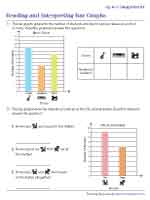
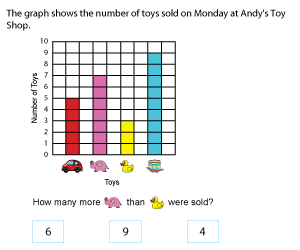
Master analyzing the data in a snap with these printables containing bar graphs of up to 4 categories. An excellent resource, this set helps kids in grade 2 and grade 3 practice interpreting vertical and horizontal bar graphs.
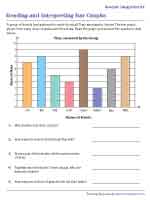
Reading and Interpreting Bar Graphs | Several Categories
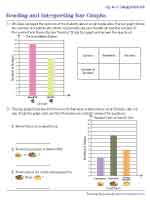
Categories on the bar graph are burgeoning! Learn to read and interpret bar graphs with several categories in these pdfs. Draw your conclusions from the pictorial representation of the data.
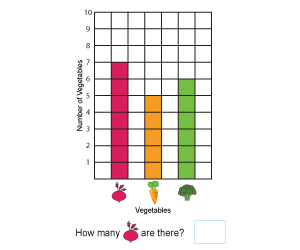
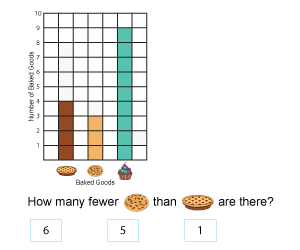
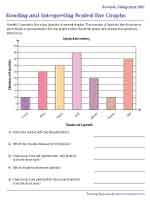
Interpreting Scaled Bar Graphs with Several Categories | Easy
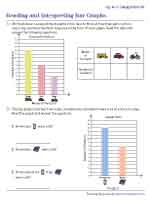
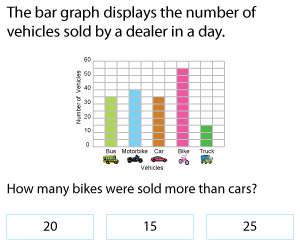
Observe the x-axis and y-axis, to calculate the scale used and analyze the data to solve the one-step "how many more" and "how many less" problems in this set of bar graphs worksheets.
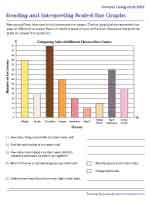
Interpreting Scaled Bar Graphs with Several Categories | Moderate
With several categories and their values depicted on the axes with a scaled key, these bar graphs task kids in grade 4 and grade 5 with using the information to solve the two-step comparison, sum, and difference problems.
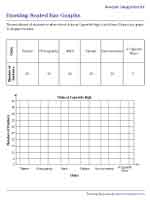
Drawing Scaled Bar Graphs | Several Categories
Once again, the smallest and greatest numbers in the data set hold the key to determining the scale of the graph. Calculate the height of each category by using the scale, and then draw the bars.
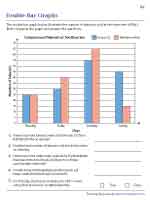
Get kids in 6th grade and 7th grade to analyze and compare the bivariate data displayed on the graph and interpret it to answer the questions in this collection of double bar graphs worksheets.