Interactive Worksheets
 Worksheets by Grade
 Number Sense and Operations
 Measurement
 Statistics and Data
 Geometry
 Pre-Algebra
 Algebra
Pictograph Worksheets
- Math >
- Statistics >
- Pictograph
If a picture is worth a thousand words, our pictograph worksheets are totally unmissable. A pictograph is a graph that represents the data using either symbols or pictures. Our printable pictograph worksheets with different themes are a perfect resource for kids to practice reading, creating, and interpreting pictographs. These pdf worksheets assist students in deciphering the key or legend that tells the number represented by each image. Begin your learning journey with some of our free worksheets!


Exclusive Pictograph Worksheets for Premium Members
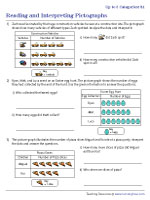
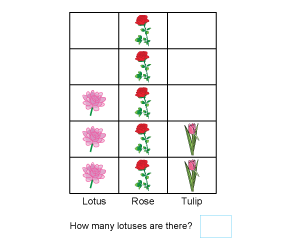
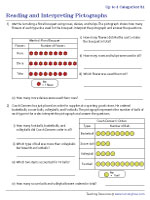
Reading and Interpreting Pictograph | Up to 4 Categories
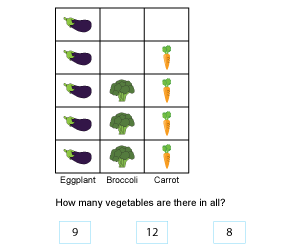
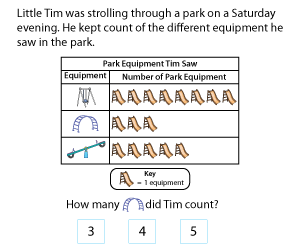
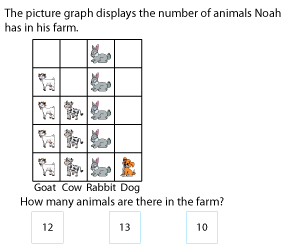
Use the key to count the symbols in each picture graph and learn to solve the one-step "how many more" and "how many less" problems using the information from the pictograph.

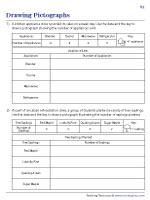
Drawing Pictographs | 4 Categories | Representing Data Using Pictographs
Create picture graphs using one-to-one correspondence and display sets of data using the keys and the symbols provided in the exercises.
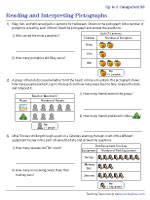
Reading and Interpreting Pictographs | Several Categories
Watch kids' high level of immersion course through this collection of pictographs worksheets, where they analyze the graph and answer the questions.
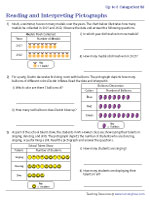
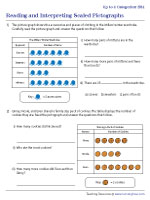
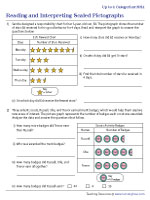
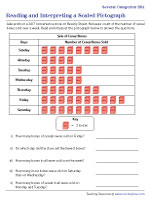
Reading and Interpreting Scaled Pictographs | Up to 4 Categories - Moderate
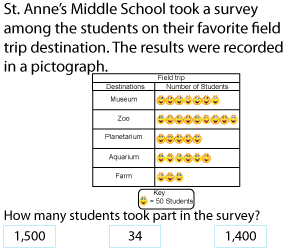
Stocked with pictographs containing up to 4 categories, this resource is a must-have for young learners in 3rd grade. These free pdfs include symbols representing multiple objects and also have half symbols.
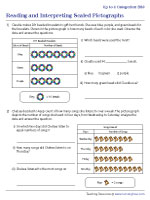
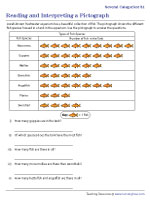
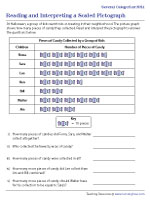
Reading and Interpreting Scaled Pictographs | Several Categories - Easy
Provide students in grade 2, grade 3, and grade 4 with an opportunity to practice reading picture graphs with scaled intervals. The symbols used here represent multiple units.
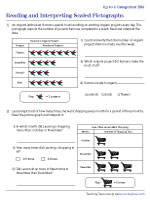
Reading and Interpreting Scaled Pictographs | Several Categories - Moderate
Designed for students in 4th grade, these picture graph worksheets have several categories. Read, interpret, and answer the two-step questions enclosed here.
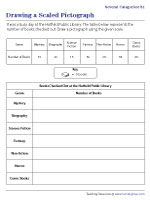
Drawing Scaled Pictographs | Several Categories
Pass every pictograph test in flying colors with these printable worksheets on picture graphs. With the help of the key, draw the required number of symbols to represent the frequency of the data.