Interactive Worksheets
 Worksheets by Grade
 Number Sense and Operations
 Measurement
 Statistics and Data
 Geometry
 Pre-Algebra
 Algebra
Line Graph Worksheets
- Math >
- Statistics >
- Line Graph
Navigate through our printable line graph worksheets to read, interpret, and draw line graphs from the data provided. Teach children how to draw a line graph and analyze how the data changes over a period of time with the help of these worksheets. This collection offers exercises in interpreting a line graph; reading double line graphs; labeling, scaling, and drawing a line graph; and more. Jumpstart your learning with our free worksheets!


Exclusive Line Graph Worksheets for Premium Members
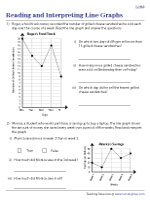
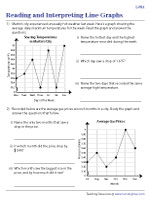
Reading and Interpreting Line Graphs | Level 2
By turns challenging and exciting, these broken-line graph worksheets pdf introduce children to decimal data points and task them with answering one-step problems based on the scenarios given.

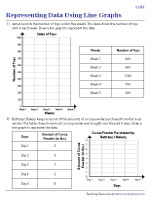
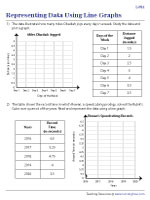
Representing Data Using Line Graphs | Level 2
A rare graphing treat for grade 7 kids, these printable drawing line graph worksheets will have them plotting decimal data points with all their heart. The trick is for them to carefully take in the tabulated data, before graphing it.
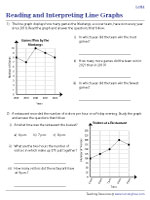
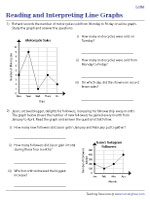
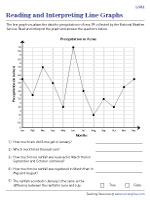
Reading and Interpreting Line Graphs | Level 3
Expand the scope of your 6th grade and 7th grade learners' line graph practice with these printable exercises, where they expertly tackle questions that require a couple of steps to solve.
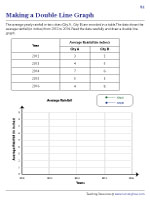
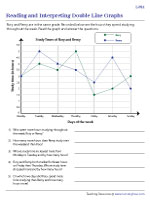
Reading and Interpreting Double Line Graphs | Level 1
Double the graph to double the fun. Forge ahead with our reading double line graphs worksheets pdf, and interpret graphs with two lines. Keenly observe the key and answer each question.
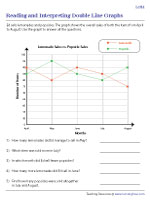
Reading and Interpreting Double Line Graphs | Level 2
Explore how, fueled by two-step questions, broken line graph practice snowballs into a data-analysis party in these worksheets, where kids interpret double line graphs depicting practical situations.
Assess how well your 8th grade students can draw a double line graph using the data provided. Watch them breeze through these exercises, effortlessly plotting decimals and whole numbers.