Interactive Worksheets
 Worksheets by Grade
 Number Sense and Operations
 Measurement
 Statistics and Data
 Geometry
 Pre-Algebra
 Algebra
Stem-and-Leaf Plot Worksheets
- Math >
- Statistics >
- Stem-and-Leaf Plots
Navigate through our stem-and-leaf plots worksheets to become skilled in analyzing, interpreting, and organizing data on plots. The stem-and-leaf plots provide students a quick review of data distribution, thereby facilitating faster computation of the mean, median, mode, and range of a collection of data. Jumpstart your learning with our free worksheets!


Exclusive Stem-and-Leaf Plot Worksheets for Premium Members
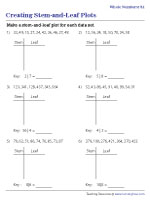
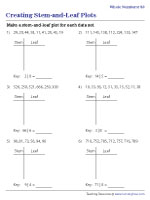
Making Stem-and-Leaf Plots | Word Problems
Learn to construct stem-and-leaf plots by placing the greatest place value digit on the stem part and the least place value digit on the leaf part of the plot.
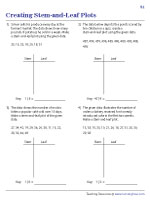

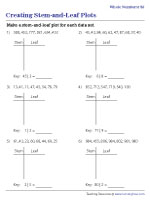
Create Plots | Decimals - Standard
Analyze the given data sets containing whole numbers and decimals, and list the stems and leaves in ascending order to make the plot in this part of our stem-and-leaf-plot worksheets.
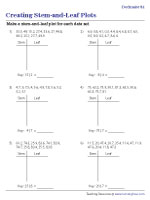
Bolster data analysis skills of 5th grade and 6th grade students as they read the word problems and use the given set of data values in decimals to make stem-and-leaf plots.
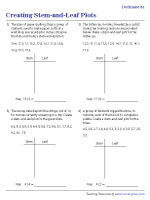
Acquire data-interpretation skills with the stem-and-leaf plots displayed in this assemblage of interesting exercises featuring whole numbers and decimals.
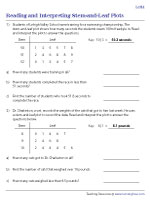
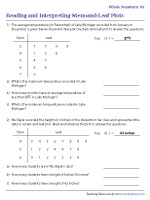
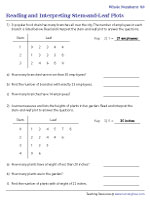
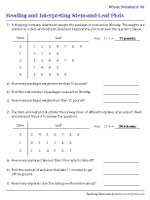
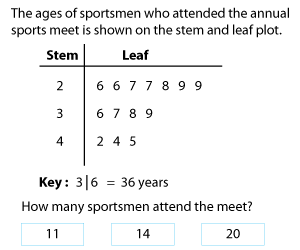
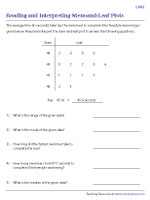
Improve the data-analyzing skills of young scholars with these printable stem-and-leaf-plots. Interpret the plot to answer the questions.
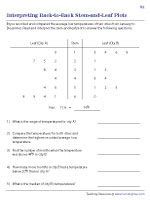
Back-to-Back Stem-and-Leaf Plots | Standard
Become adept at representing two distinct data sets in a single plot with these worksheets on stem-and-leaf-plots for grade 6 and grade 7.
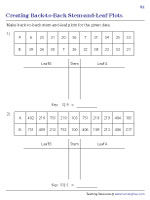
Navigate through these exercises and practice creating back-to-back stem-and-leaf plots by displaying the two sets of data on either side of the stem.
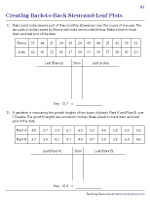
Gain adequate practice in reading and interpreting back-to-back stem-and-leaf plots with these resources drafted exclusively for students in 7th grade and above.