Pie Graph Worksheets
- Math >
- Statistics >
- Pie Graph
Enhance your data analysis skills with this collection of pie graph worksheets! These circle graphs help learners visualize data, interpret the information provided, and answer related questions. The data is represented using whole numbers, percentages, and fractions. Use the attached answer key for guidance. Start now with our free worksheets!
Exclusive Pie Graph Worksheets for Premium Members
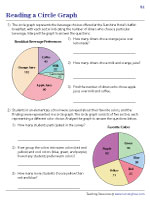
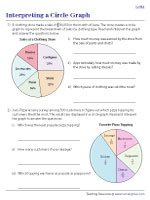
Interpreting a Pie Graph | Two Step
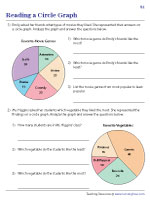
Practice reading and interpreting data presented in a circle graph. Analyze the data and perform basic addition or subtraction to answer the questions provided.

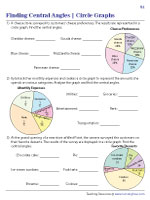
Finding Central Angles in a Circle Graph
These circle graphs display data from surveys on different topics. Use the provided information to calculate and write the central angle for each category in these printables.

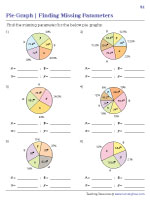
Circle Graph and Central Angles | Find the Missing Parameters
Work with pie graphs displaying data and calculate the missing parameters, such as central angles or percentages, for one or more sections in each graph.

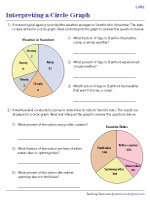
Interpreting a Pie Chart | Fractions and Percentages - Level 1
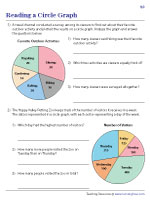
The shaded sections in each pie chart represent data from various surveys. Interpret the data presented in fractions and percentages, and then answer the questions.

Interpreting a Circle Graph | Fractions and Percentages - Level 2
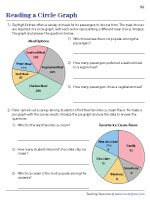
Begin by studying the circle graphs, and then answer the related questions. This exercise requires converting whole numbers into percentages or fractions.

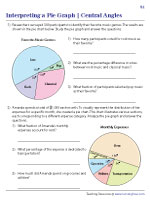
Interpreting a Pie Graph | Central Angles Given
Interpret the circle graphs in these pie graph worksheets using the provided central angles. Convert the angles into fractions and percentages to represent the distribution of data.

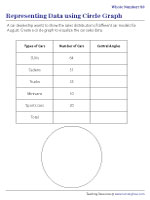
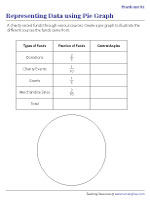
Representing Data Using a Pie Chart | Fractions
Review the data provided in the form of fractions representing different categories. Convert the fractions into central angles, and use them to create accurate pie graphs.

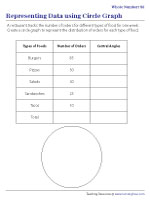
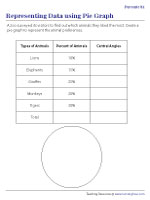
Representing Data Using a Pie Graph | Percentage
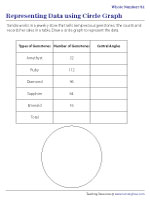
Complete this exercise by drawing a pie graph for each set of data provided in percentages. Label and shade the sections to represent each category accurately.


 Interactive Worksheets
 Worksheets by Grade
 Number Sense and Operations
 Measurement
 Statistics and Data
 Geometry
 Pre-Algebra
 Algebra
