Interactive Worksheets
 Worksheets by Grade
 Number Sense and Operations
 Measurement
 Statistics and Data
 Geometry
 Pre-Algebra
 Algebra
Graph the Linear Functions Worksheets
Gain quite the rep as the in-house linear functions specialist with these free, printable graphing linear functions worksheets for high school learners. A linear function is in the form f(x) = mx + b. Math mavens graph a linear function by finding the x-intercept and y-intercept.
These pdf worksheets are ideal for eighth grade and high school students.
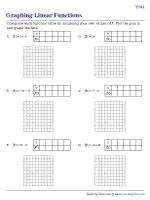
Graphing Linear Functions | Type 1
Direct grade 8 students to equate f(x) to zero, plug the values of x in the function, and find the y-intercept. Once the input-output table is completed, all that's left to do is plotting the graph, which unfolds into a straight line.
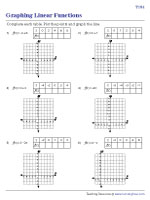

Graphing Linear Functions | Type 2
Nail every test on graphing linear functions with this bundle of 8th-grade pdfs. Complete the function table by finding the missing values of x and f(x). Plot the points to graph the linear function.
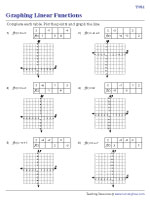
Graphing Linear Functions | Type 3
Graphs in every nook and cranny, this set of worksheets tasks high school students with using their own values of x, substituting in f(x) to find the y coordinates, and plotting the points on the coordinate plane.