1st Grade Math Worksheets
Explore our 1st-grade math worksheets with answer keys and exercises for kids to enhance their skills in extending forward and backward number sequences, solving addition and subtraction problems within 20, understanding place value and ordinal number systems, measuring objects with standard and non-standard tools, identifying and completing patterns, comparing sizes, telling time in different intervals, counting money, interpreting data from pictographs, tally charts, and bar graphs, and recognizing attributes of 2D shapes in geometry. Our free worksheets are beginner-friendly and a must-try!
Select Grade 1 Math Worksheets by Topic
Explore First Grade Data and Graphs Worksheets
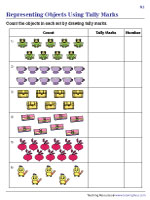
Representing Objects with Tally Marks
Draw tally marks to represent the number of objects with four vertical lines and one diagonal line through them to make a group of 5 and effortlessly count the total objects.

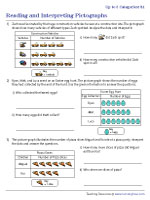
Reading and Interpreting Pictographs | Up to 3 Categories
Read the pictographs with pictures or symbols to represent data in up to three categories and answer questions based on your interpretation.

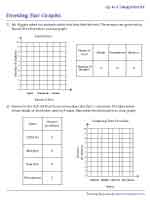
Drawing Bar Graphs | Up to 4 Categories - Column
Visualize data by constructing vertical bar graphs to represent the information given in the table.

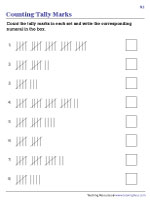
Count each complete group of tally marks with four vertical lines and one diagonal line crossing through them in 5s. Add any extra marks that don’t form a full set, and write the total number in the box.

Drawing Pictographs | 4 Categories | Representing Data Using Pictographs
Create a pictograph that visually represents the number of appliances sold, saplings planted, and ice creams sold, using the provided data and key.

Reading and Interpreting Bar Graphs | Up to 3 Categories
Study each bar graph displaying data up to three categories and answer questions based on your interpretation of the data.

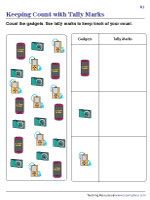
Keeping Count with Tally Marks
Count the gadgets, stationery items, and fruit using tally marks to keep track of your count.

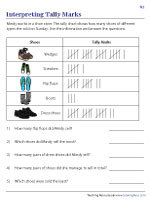
Read and Interpret | Tally Marks Word Problems
Analyze the data tracked using tally marks. Count and compare the data to answer questions.

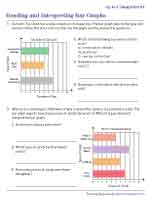
Reading and Interpreting Bar Graphs | Up to 4 Categories - Horizontal
Study the horizontal bar graph and draw insights from the data. Tackle the questions to demonstrate your comprehension skills.

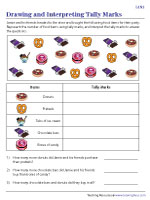
Draw and Interpret | Tally Marks Word Problems
Mark the number of items using tally marks, and use your interpretation of these marks to answer the questions provided.


 Interactive Worksheets
 Worksheets by Grade
 Number Sense and Operations
 Measurement
 Statistics and Data
 Geometry
 Pre-Algebra
 Algebra
