2nd Grade Math Worksheets
Explore our 2nd grade math worksheets to help kids master place value in three-digit numbers, number decomposition, rounding, and problem-solving with addition, subtraction, and multiplication. Practice measuring lengths and liquid volumes, telling time, handling money, and analyzing shapes. Interpret data with tally marks, pictographs, line plots, and bar graphs. Use our answer keys for instant evaluation. Add our free worksheets to your must-try list and watch kids excel in math effortlessly.
Select Grade 2 Math Worksheets by Topic
Explore Second Grade Data and Graphs Worksheets
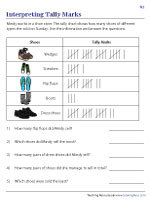
Read and Interpret | Tally Marks Word Problems
Challenge learners to read and interpret the tally word problems. Carefully count the tally lines and provide thoughtful responses to a series of questions.

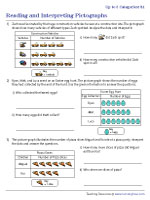
Reading and Interpreting Pictographs | Up to 3 Categories
The key provided at the bottom of the pictograph tells us how many items are represented by each picture on the graph. Examine and understand the graph in order to accurately respond to questions based on it.

Reading and Interpreting Bar Graphs | Up to 3 Categories
Scrutinize each bar graph featuring up to 3 categories, use the length of the bar to figure out the quantity of each item, and answer the questions.

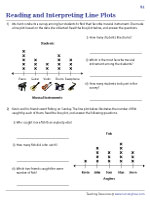
Reading and Interpreting a Line Plot | Basic
Examine the graphical representation of data on a line plot, and answer the set of questions based on the line plot.

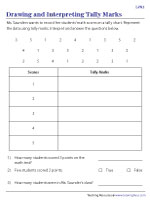
Drawing and Interpreting Tally Marks | Ungrouped Discrete Data
In this section, ungrouped discrete data is given. Organize the data by drawing tally lines, and then proceed to answer the questions.

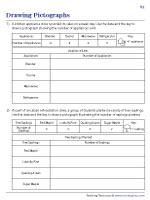
Drawing Pictographs | Up to 4 Categories
Display the data set as a picture graph using the key and symbol provided in each problem.

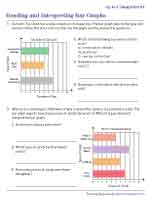
Read and Interpret Bar Graphs | Up to 4 Categories - Horizontal
Look at visual depiction of data displayed as horizontal bars of varying lengths, analyze the data, and answer the questions.

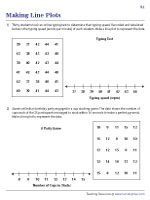
Making a Line Plot | Whole Numbers
Read the word problem, use cross marks to represent the given data set on a number line, and construct a line plot.

Drawing Bar Graphs | Up to 4 Categories - Column
Analyze and interpret the word problem, and record the given information on the vertical bar graph.

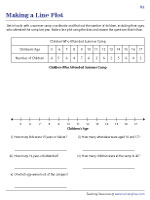
Making a Line Plot - Activity and Interpret
Learn how to interpret data and create a line plot with this exclusive resource.Don't forget to answer the list of questions at the bottom of the sheet.

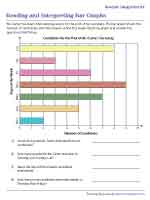
Interpreting Bar Graphs | Several Categories - Horizontal
Here, the data is represented horizontally using bars of different lengths. Compare the data for different categories and answer the questions.

Interpreting Bar Graphs | Several Categories - Column
Study the bar graph with several categories, make your own conclusion about the data, and test your data interpretation skills.


 Interactive Worksheets
 Worksheets by Grade
 Number Sense and Operations
 Measurement
 Statistics and Data
 Geometry
 Pre-Algebra
 Algebra
